Vault #8: By the Numbers
measuring the Impact of the Angel Island Immigration Station
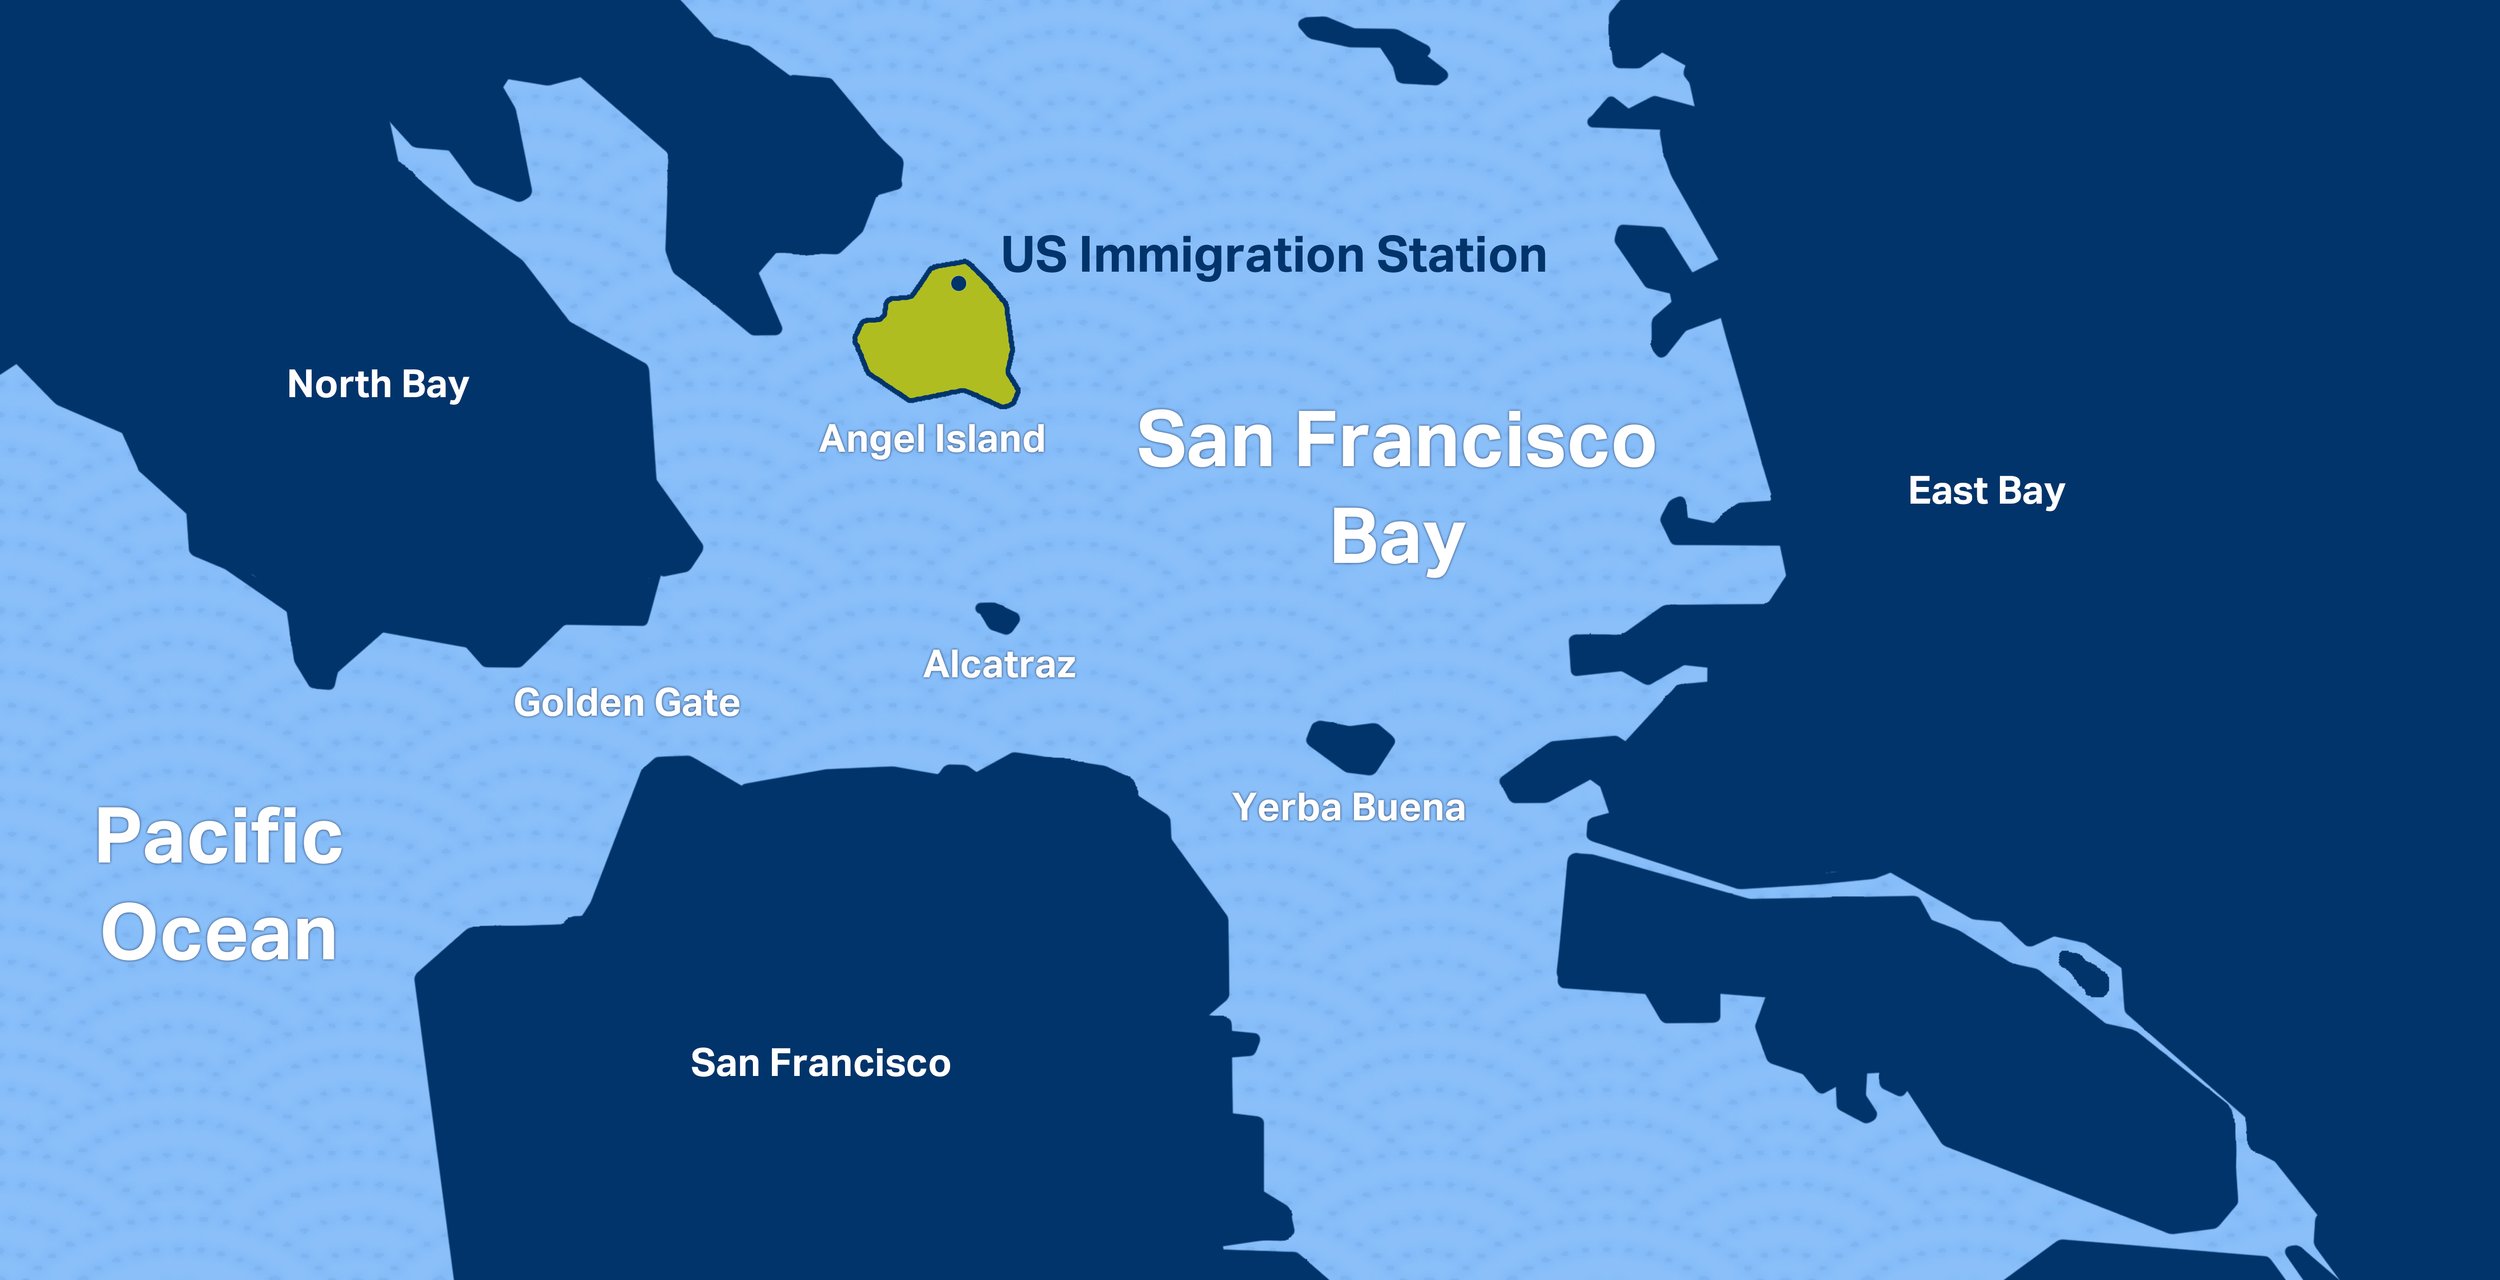
Migration Through the Golden Gate

The one million figure is based on data taken from annual immigration reports.
550,469 Arrivals
(341,363 noncitizens; 209,106 US residents)
665,430 Departures
(482,919 noncitizens; 182,511 US residents)
Arrivals by Country
While most of the 550,469 arrivals were immigrants, non-immigrants (temporary visitors) and American citizens were also processed by the Bureau of Immigration through the Port of San Francisco. The list below shows the largest groups by place of birth (1910 - 1940).
Top Ten Countries (in order)
China, United States, Japan, Germany, Russia, Philippines, Korea, India, Mexico, United Kingdom
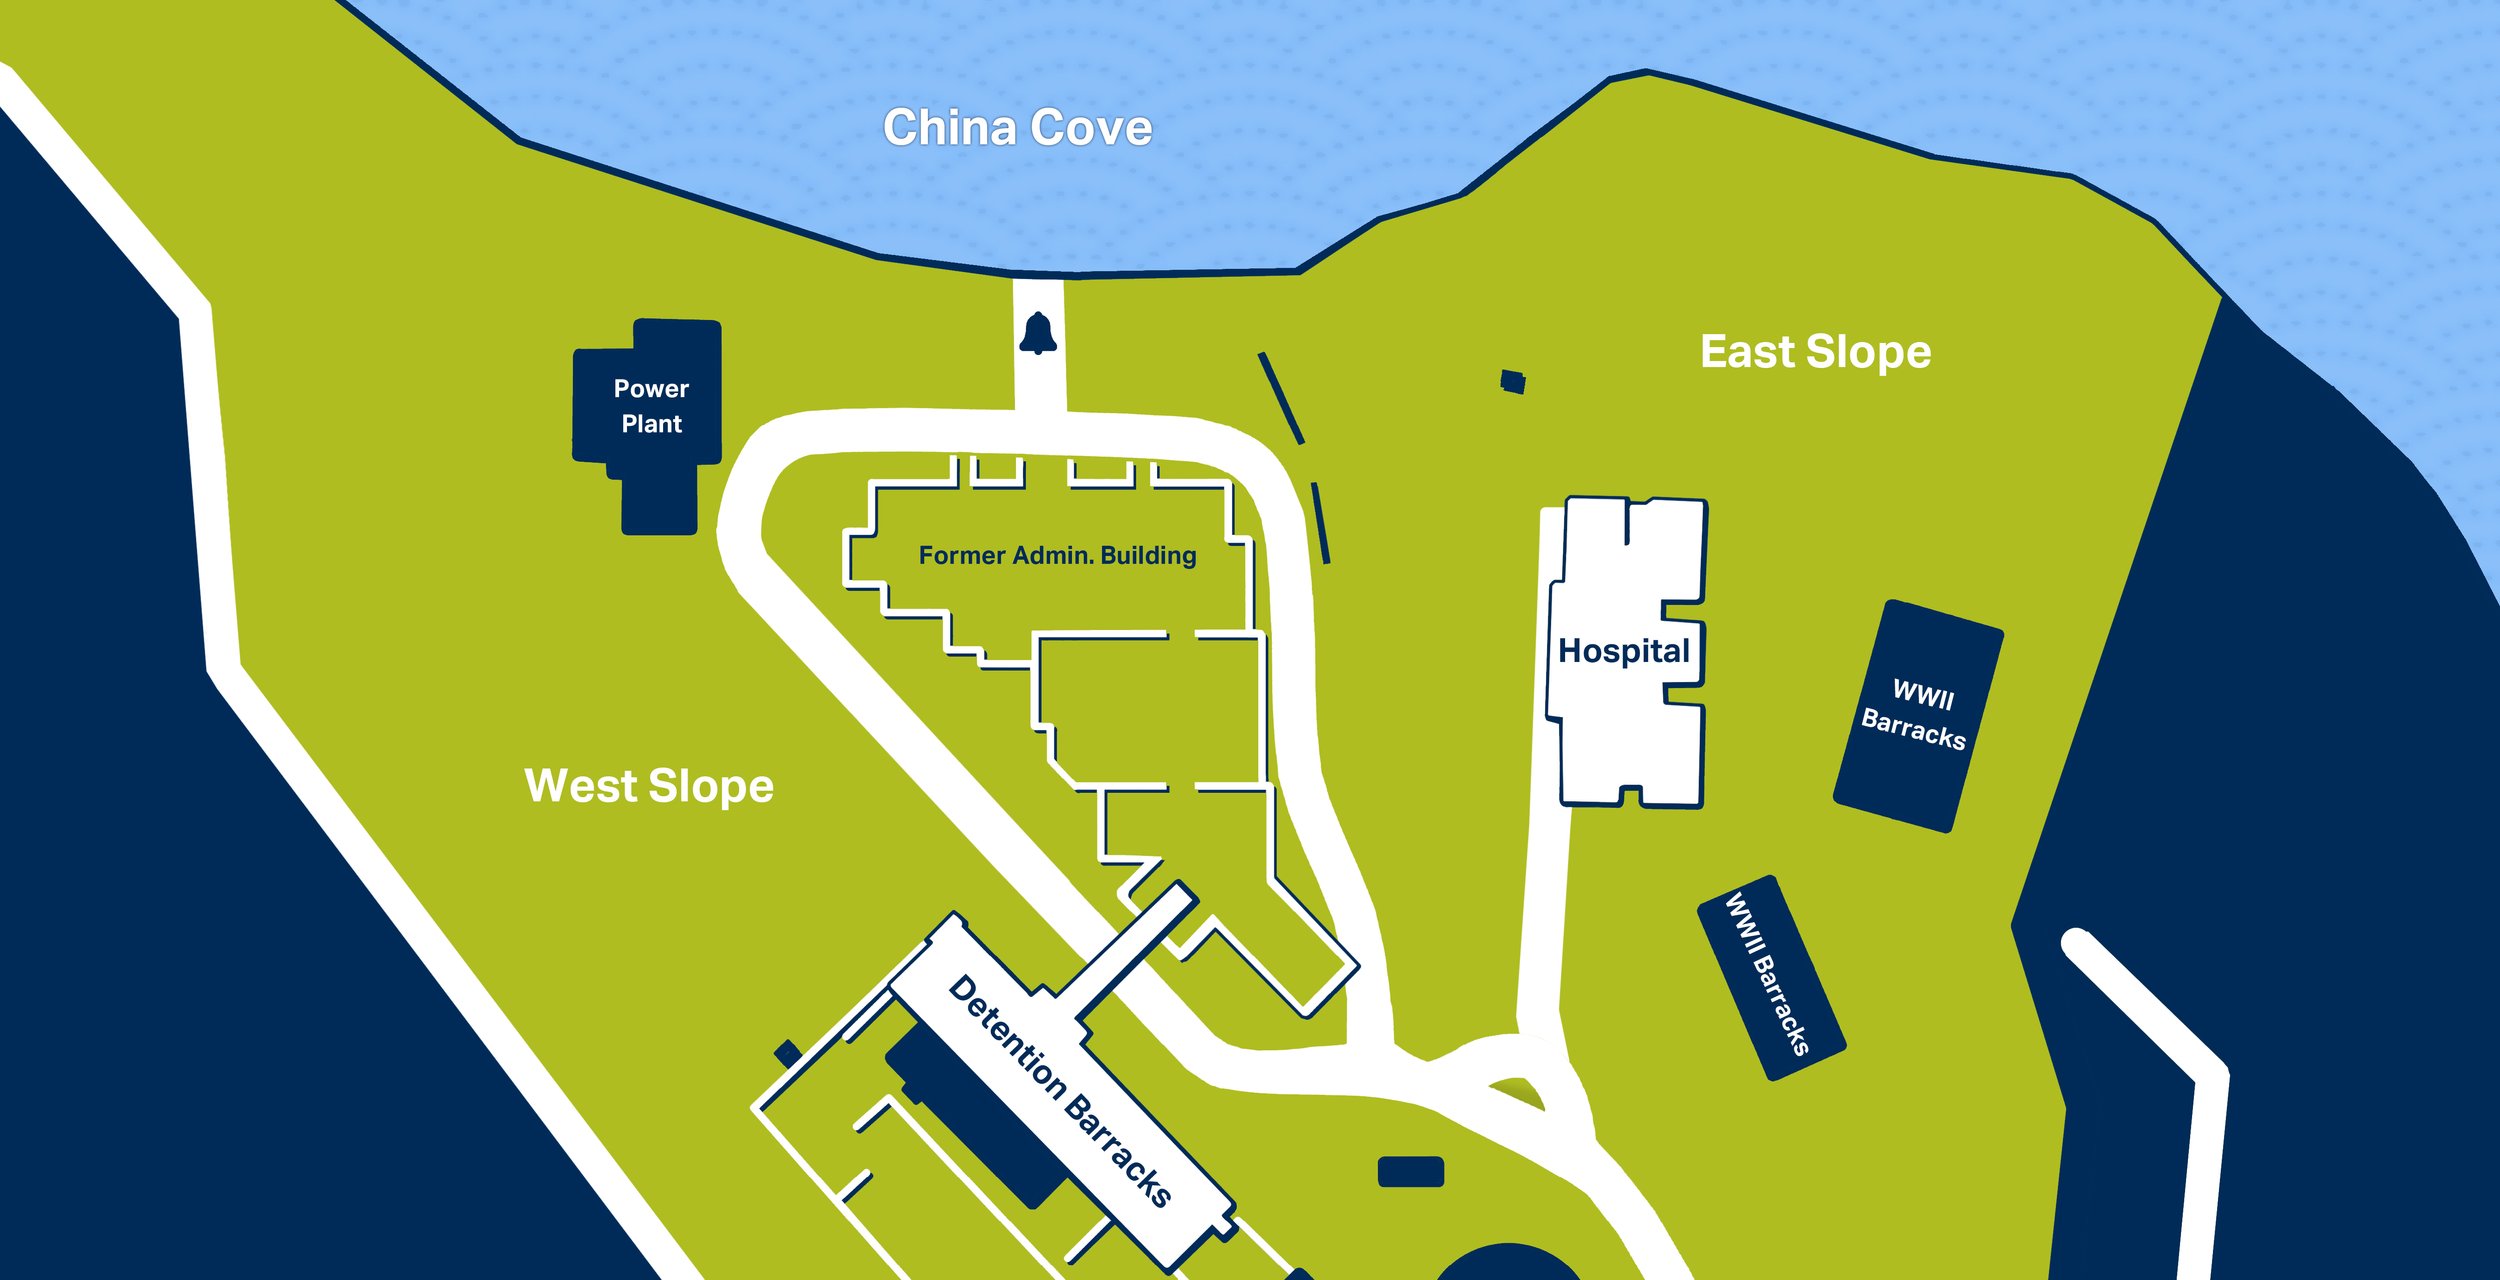
The Immigration Station was built to detain between 700 to 1,000 individuals. They were held in three principal buildings at the site: the Detention Barracks (230 to 350 men), the Hospital (60 to 80 patients), and the Administration Building (200 to 240 women). Photo credit: AIISF, 2023.
Angel Island Detainment
Not all arrivals were sent to Angel Island. The 14.3-acre site served as a secondary inspection point for anyone whose citizenship, health, or paperwork was in doubt—or if they were from a country or class excluded by US law.

Out of 550,469 arrivals, a disproportionate number of Asians were detained over non-Asians (2:1). This is reflected in the estimated totals of those held on Angel Island. Chinese immigrants represented one-third of all detained individuals. The following list shows the largest number of persons detained by ethnicity (values are approximate).
Chinese (100,000), Japanese (85,000), South Asians (8,000), Russians and Jews (8,000), Koreans (1,000), Filipinos (1,000), Mexicans (400)
We believe 60% of all arrivals were held at the Immigration Station for at least three days. Because of the Chinese Exclusion Act, Chinese immigrants were detained longer on average (three weeks to three months). The longest-known detentions on Angel Island were more than a year or two: Kong Din Quong (756 days/25 months) and Quok Shee (600 days/20 months)
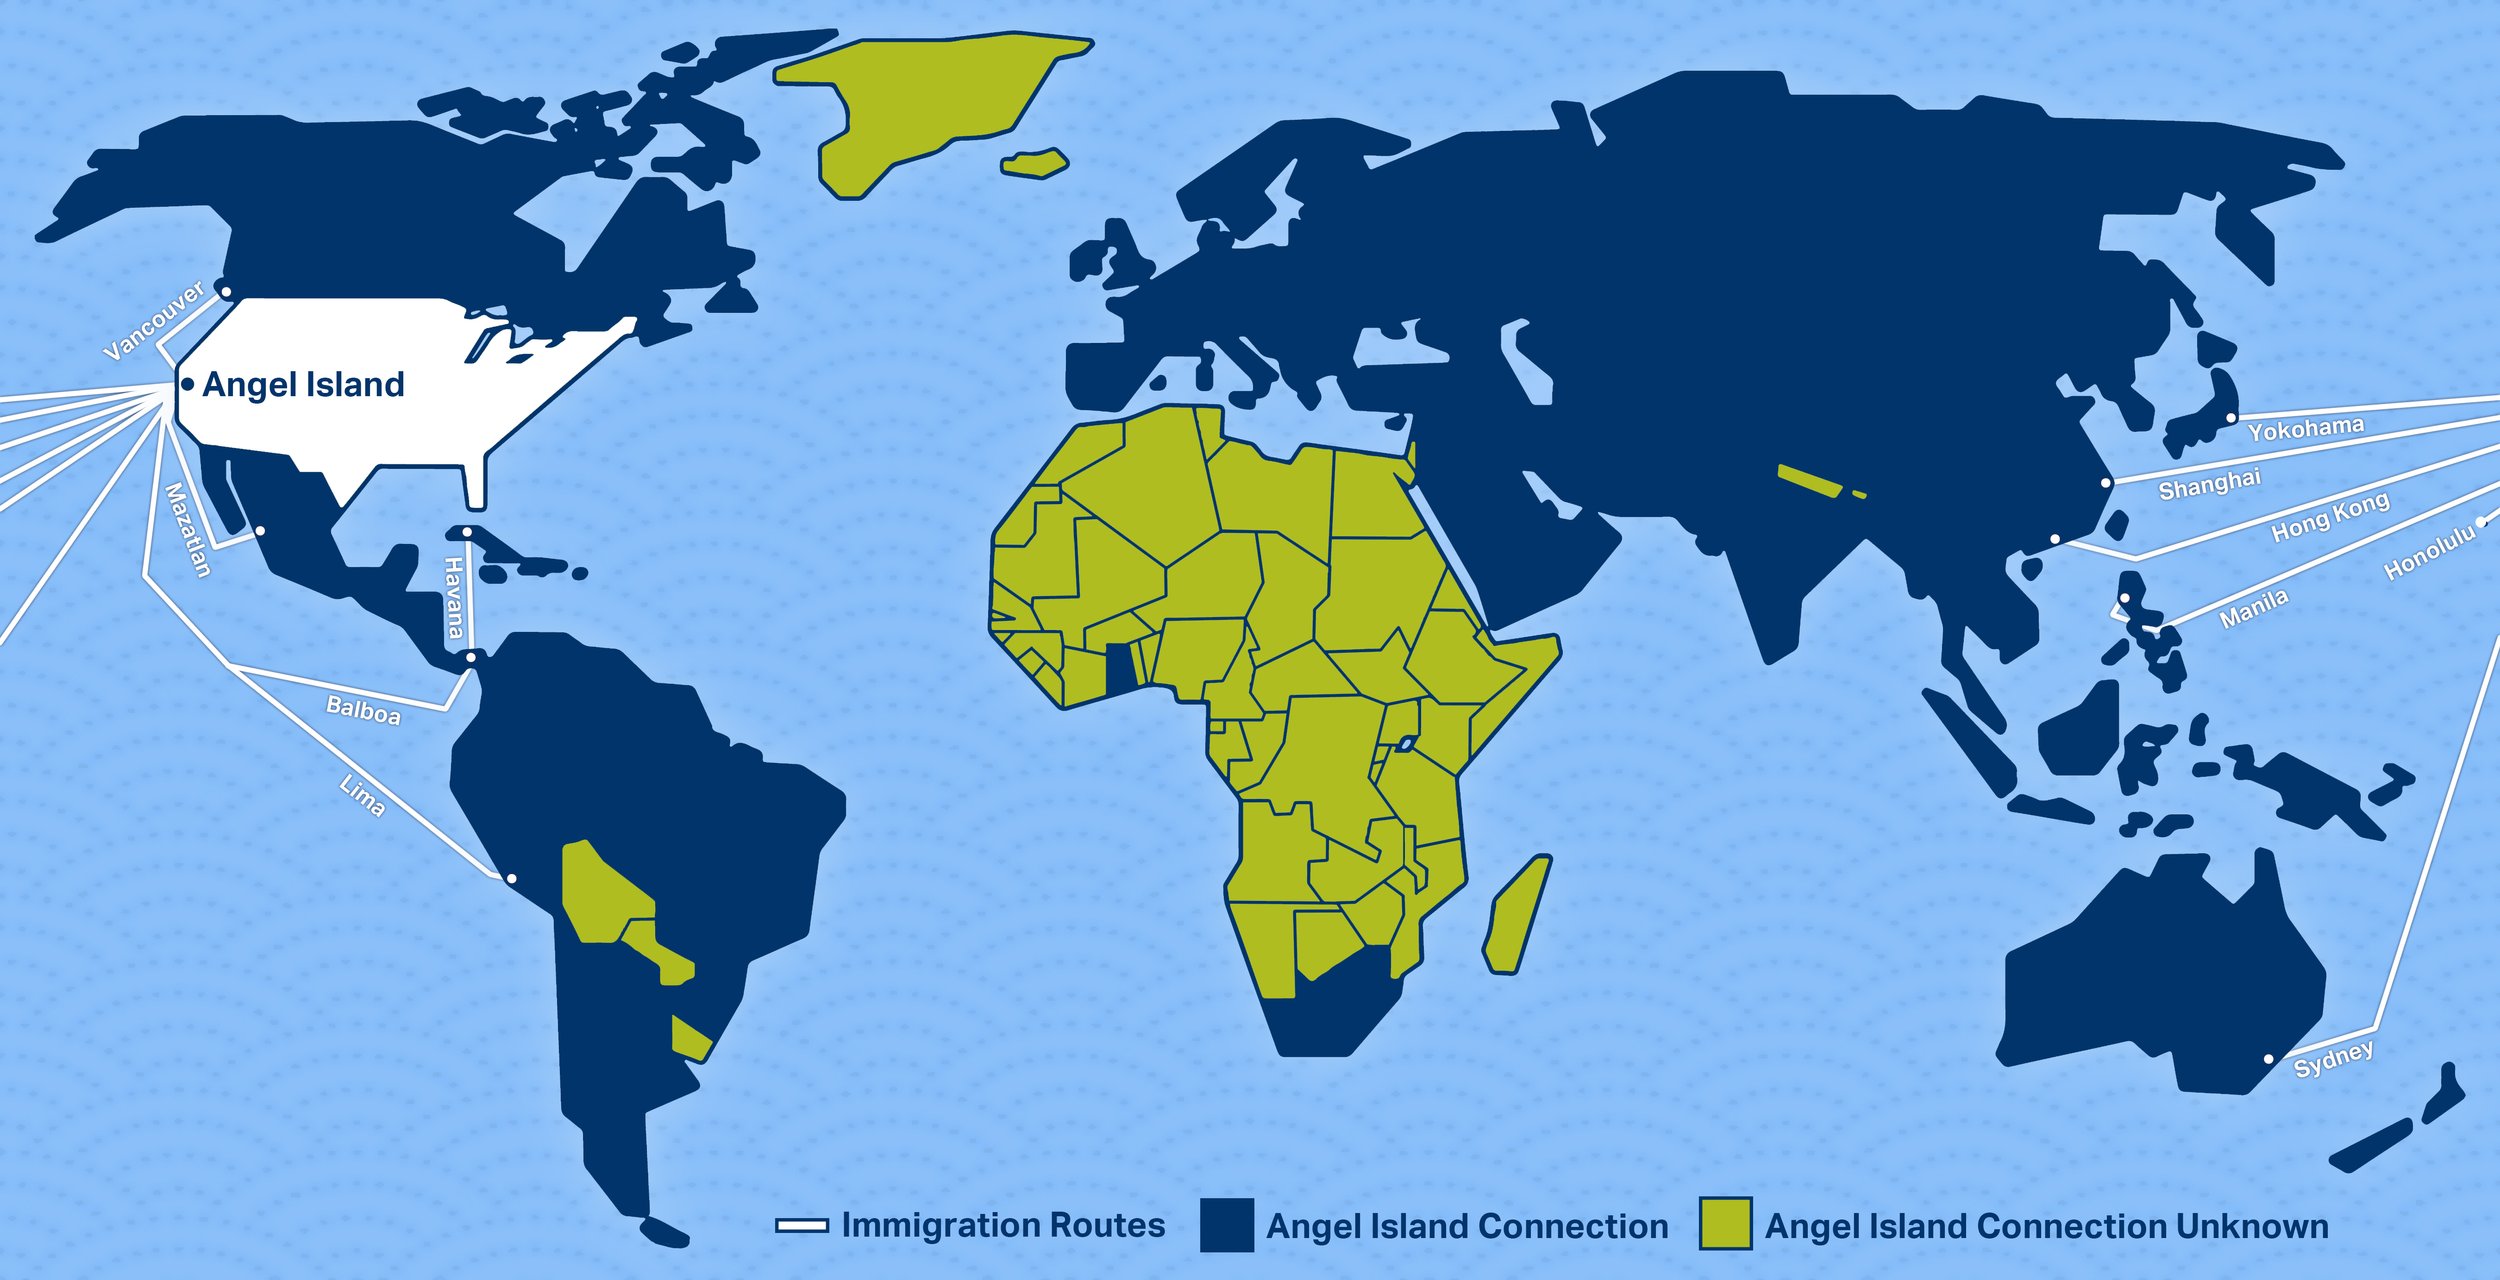
This map identifies immigrant homelands using historic territorial boundaries. Immigrants from across six continents arrived on Angel Island between 1910 and 1940. Most left for the United States aboard steamships from 11 ports in Asia, Australia, North America, and South America. Some arrived at the US border or other immigration stations and were transported to San Francisco. Photo credit: AIISF, 2023.
Individuals by Country and Region

On Angel Island, arrivals were separated into two racial categories: Asian and non-Asian (“European”). However, this categorization did not account for the diversity of cultures, languages, or national origins of those detained.
Below are the countries, islands, regions, and US territories whose citizens were detained at the Angel Island Immigration Station.
North America
Alaska (US territory until 1959)
Canada
Costa Rica
El Salvador
Guatemala
Honduras
Mexico
Nicaragua
Panama
United States of America
West Indies¹ (Antigua* & Barbuda, Aruba, Bahamas, Barbados, Bermuda*, Cuba, Dominica, Dominican Republic*, Grenada*, Haiti, Jamaica, Martinique, Puerto Rico*, Saint Kitts & Nevis, Saint Lucia, Saint Vincent & the Grenadines, Trinidad* & Tobago, US Virgin Islands, et al.)
South America
Argentina
Brazil
Chile
Columbia
Ecuador
Peru
Suriname
Venezuela
Africa+
Cape Verde
French Somaliland (Djibouti)
Ghana
Mauritius
South Africa
Europe
Armenia
Austria
Azores¹
Belgium
Bulgaria
Czechoslovakia (Czech Republic)
Denmark
England
Estonia
Finland
France
Germany
Greece
Hungary
Ireland
Italy
Latvia
Lithuania
Luxembourg
Netherlands
Norway
Poland
Portugal
Romania
Russia
Scotland
Spain
Sweden
Switzerland
Turkey
Yugoslavia² (Bosnia & Herzegovina, Croatia, Macedonia, Slovenia, Serbia, Montenegro)
Asia
Afghanistan
Arabia² (Jordan, Kuwait, Oman, Qatar, Saudi Arabia, United Arab Emirates, Yemen)
Burma (Myanmar)
Ceylon (Sri Lanka)
China
Dutch East Indies¹ (Borneo*, Celebes, Java, Lesser Sunda Islands, Madura, Moluccas, Sanguine, Sumatra*, Talaud Islands)
Formosa (Taiwan)
French Indochina² (Cambodia, Laos, Vietnam*)
Hong Kong
India
Indonesia
Iraq
Japan
Korea² (North Korea, South Korea)
Macau
Malaysia
Mongolia
Persia (Iran)
Philippines
Siam (Thailand)
Siberia
Singapore
Syria
Australia and Oceania
Australia
Fiji
Hawaii (US territory until 1959)
Oceania¹ (Australasia, Melanesia, Micronesia, Polynesia)
New Zealand
Samoa (US territory)
Tahiti
——————
¹ Island nations and territories were sometimes listed by their geographic region.
² Regions that included (or were later divided into) several countries.
* Countries within regions whose names appeared on immigration documents.
+ Africa was often listed as a region. Only a few countries in Africa were listed by name.
Lee, Erika, and Judy Yung. Angel Island: Immigrant Gateway to America. Oxford ; New York: Oxford University Press, 2010.
NARA. Correspondence, Assistant Surgeon Melvin W. Glover to the Commissioner-General of Immigration, April 9, 1910.
NARA. Correspondence, Assistant Surgeon Melvin W. Glover to the Surgeon-General of the United States, January 26, 1912.
NARA. “San Francisco District Reports,” 1937–1940, Record Group 85.
NARA. Records of the Immigration and Naturalization Service, RG 85, Investigation Arrival Case Files, 1884–1944.
US Congress, House. Statistical Abstracts of the United States, 1936.
US Department Commerce and Labor. Annual Report of the Commissioner-General of Immigration, 1910–1912.
US Department of Justice, INS. “Report of Passenger Travel between the U.S. and Foreign Countries, by Ports as Specified,” 1931 to 1940.
US Department of Labor, INS. “U.S. Citizens Arriving from Foreign Countries,” 1936–1940.
US Department of Labor. Annual Report of the Commissioner-General of Immigration, 1913–1932.